Metric graph
How to view file size and metadata values as a per-frame line chart.
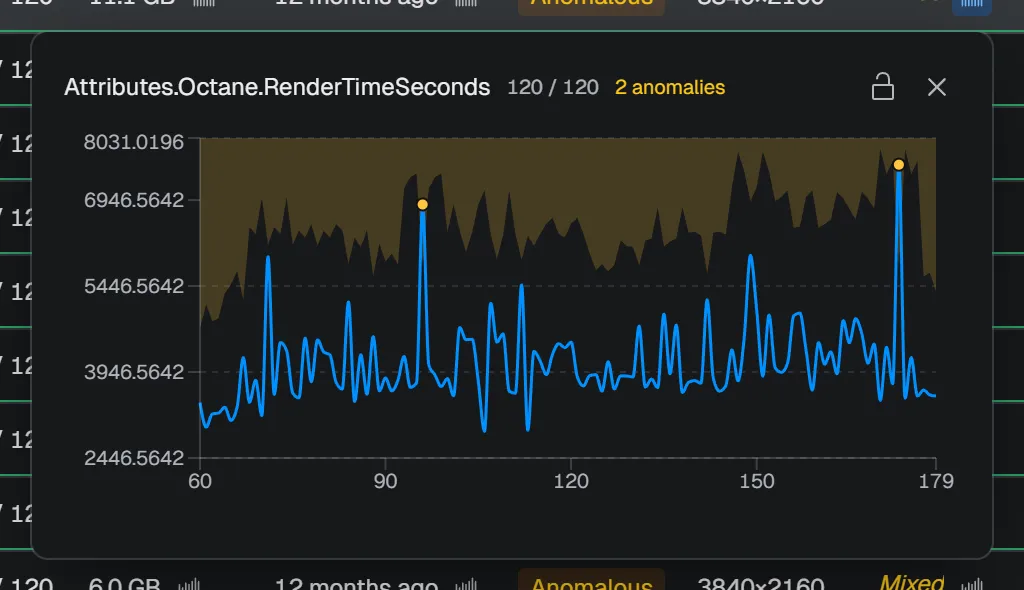
The metric graph lets you view per-frame numbers as a line chart. Use it to spot sudden changes in file size, or changes in metadata such as exposure value or ISO.
Opening it
Press the graph icon next to a numeric cell in the table (Plot per-frame values) to open it. Press the same button again, or click outside, to close it.
Metrics you can show
You can show the Total size and Modified columns, as well as numeric values from added metadata columns (exposure, ISO, color channel statistics, and so on).
Reading the chart
The X axis is the frame number and the Y axis is the value. For metrics that have anomaly detection rules configured, matching frames are shown as amber dots. The area outside the allowed range is shown as an amber band (zone fill), and thresholds are drawn as dashed lines. Hover over a point to see its frame number, value, and detection reason. The header shows the current value, the loading progress, and the anomaly count.
Locking and switching graphs
When you press the button on a different row or a different metric, the currently open graph closes automatically unless it is locked.
The lock icon in the header lets you lock a graph (tooltip Lock graph open / Unlock graph). A locked graph does not close when you click outside, and stays visible even when you open a graph for a different row or metric. With one locked graph and one currently open graph, at most two graphs are shown on screen at a time.
Loading metadata
Metadata-derived values come from the image analysis results. The first display can take a little time to load. While a graph is open, the frames it needs are loaded with priority.